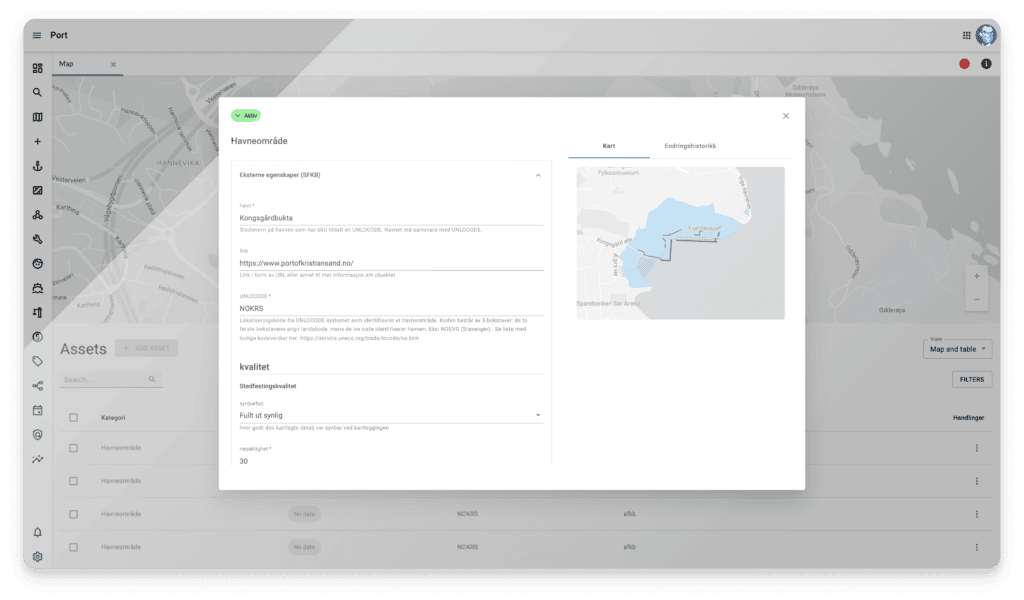
We’ve reached a new milestone in the project «Norwegian digital port infrastructure». Ports can now easily maintain and share own assets in their Port management information system (PMIS). This reduces manual tasks and creates a common situational picture for users
The project builds on the competence, technology and digital foundation developed during three previous public-private projects. Scheduled for completion towards the end of 2022, this project will further develop the ports’ PMIS, and then establish a comprehensive solution that will reach all Norwegian ports.
New registration instructions for port data
This autumn the Norwegian Mapping Authority published a new version of the Port Data Standard. The document describes all port data assets in detail specifying how surveying of them are to be done. This ensures that port data are registered in the same way for all ports enabling a scalable national solution.
The new types of port asset data added in version 2.0 are:
- Boatslip
- Floating dock
- Operational area
- Dry dock
- Harbour fence entrance
- Camera
- Discharge area
In addition, two types of regulations have been added:
- Speed restrictions
- Prohibited areas
New speed limits at sea in 2022
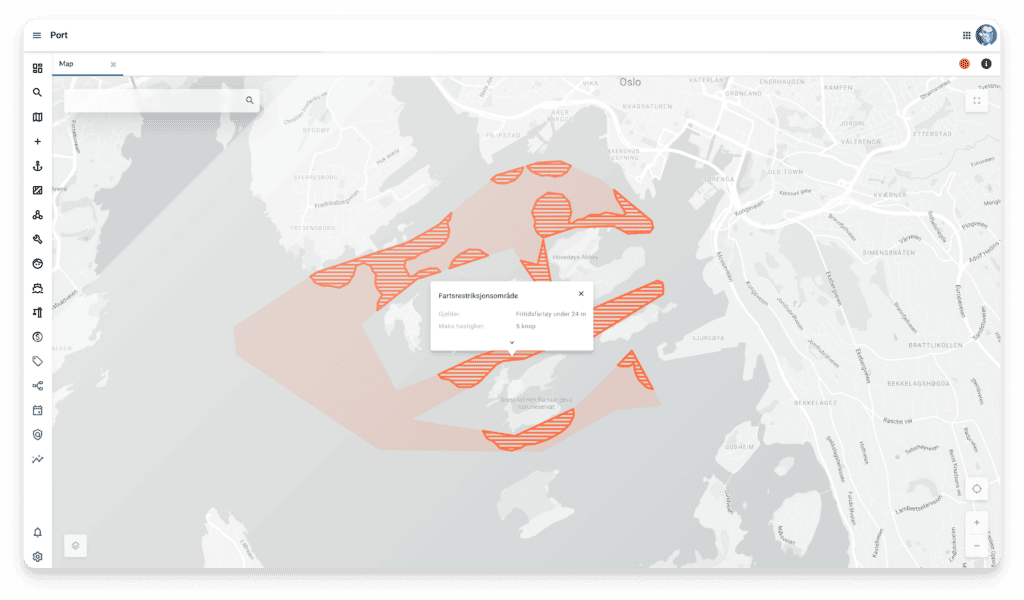
The Norwegian Coastal Administration adopted a new regulation on speed limits at sea. It entered into force on 1 January 2022, at the same time cancelling around 125 local speed regulations in 95 municipalities. This means that municipalities (i.e ports) now regulate speed limits for leisure boats in own sea area.
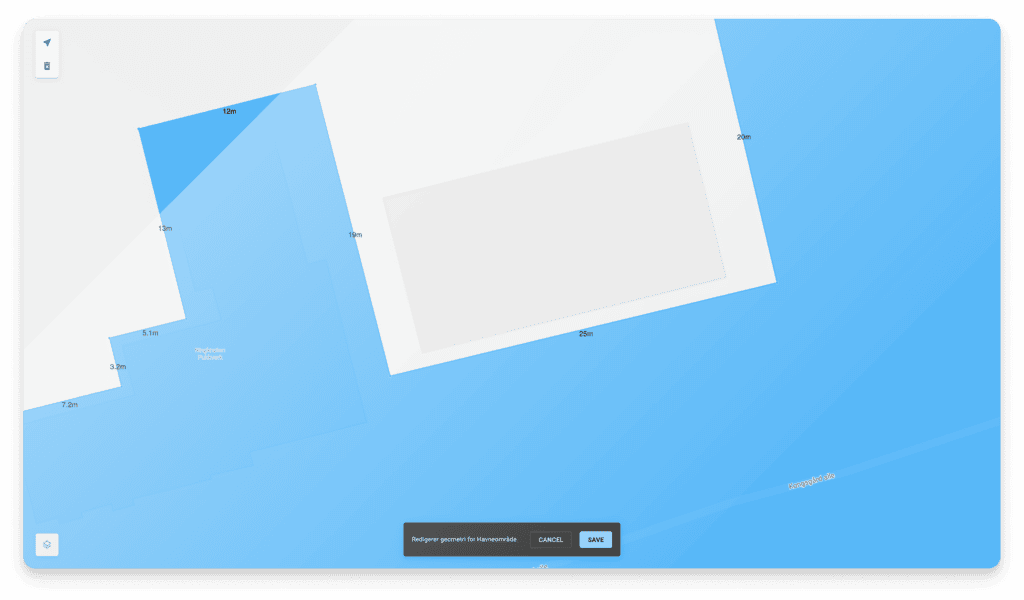
It is, therefore, important for ports to have an efficient tool to register speed restrictions, and to share this information with leisure vessels. The new editing tool is a bullseye for this purpose. Here you can quickly draw up an area, as well as register its properties, such as a a valid speed limit.

It has been important to create operational services on top of port asset data, which provides immediate value for users. In collaboration with the ports, we have co-created flexible tools where the users are largely in the driver’s seat in the design of their digital map surfaces.
Dag Erik Henriksen, Team Leader, Grieg Connect
Easy to maintain and add port asset data
The example of speed restrictions shows how the ports through their PMIS can upkeep own port data. At the same time, the PMIS synchronise updates with the Mapping Authority’s database from where they are made available to third parties. An example could be apps that boaters use to orientate themselves at sea.
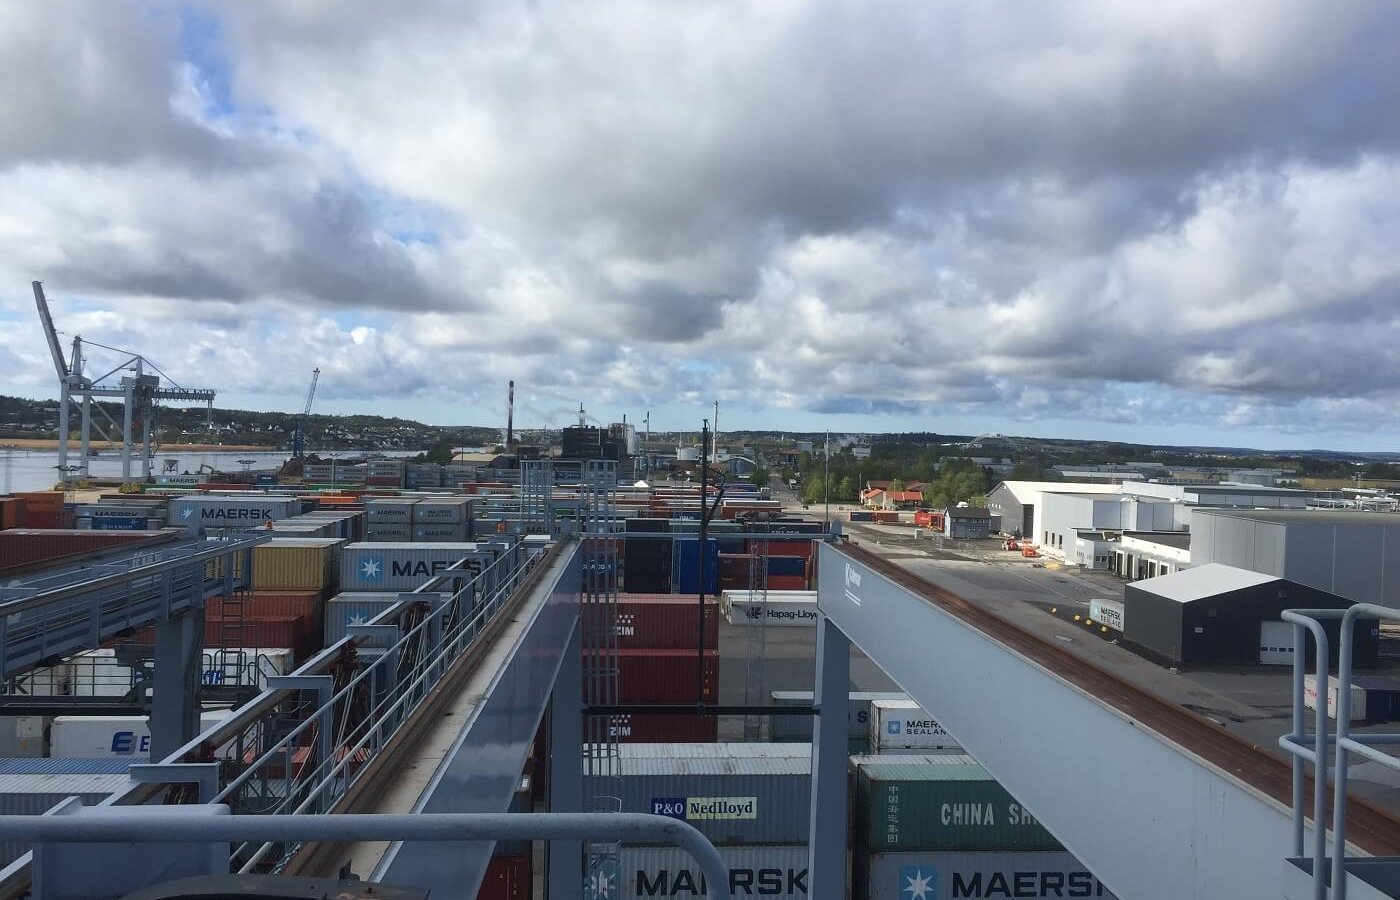
For cargo traffic, it is crucial to get updated data on mooring bollards. For ports it is important to be able to instantly share information about changes to operational plans – f ex if the bollard to which a vessel should moor is changed or a bollard is no longer in use.
The scanned port asset data in the Mapping Authority’s database may also lack information, such as name of the quay or contact person for ISPS. The ports can easily add this via their PMIS so that it becomes available to everyone immediately.
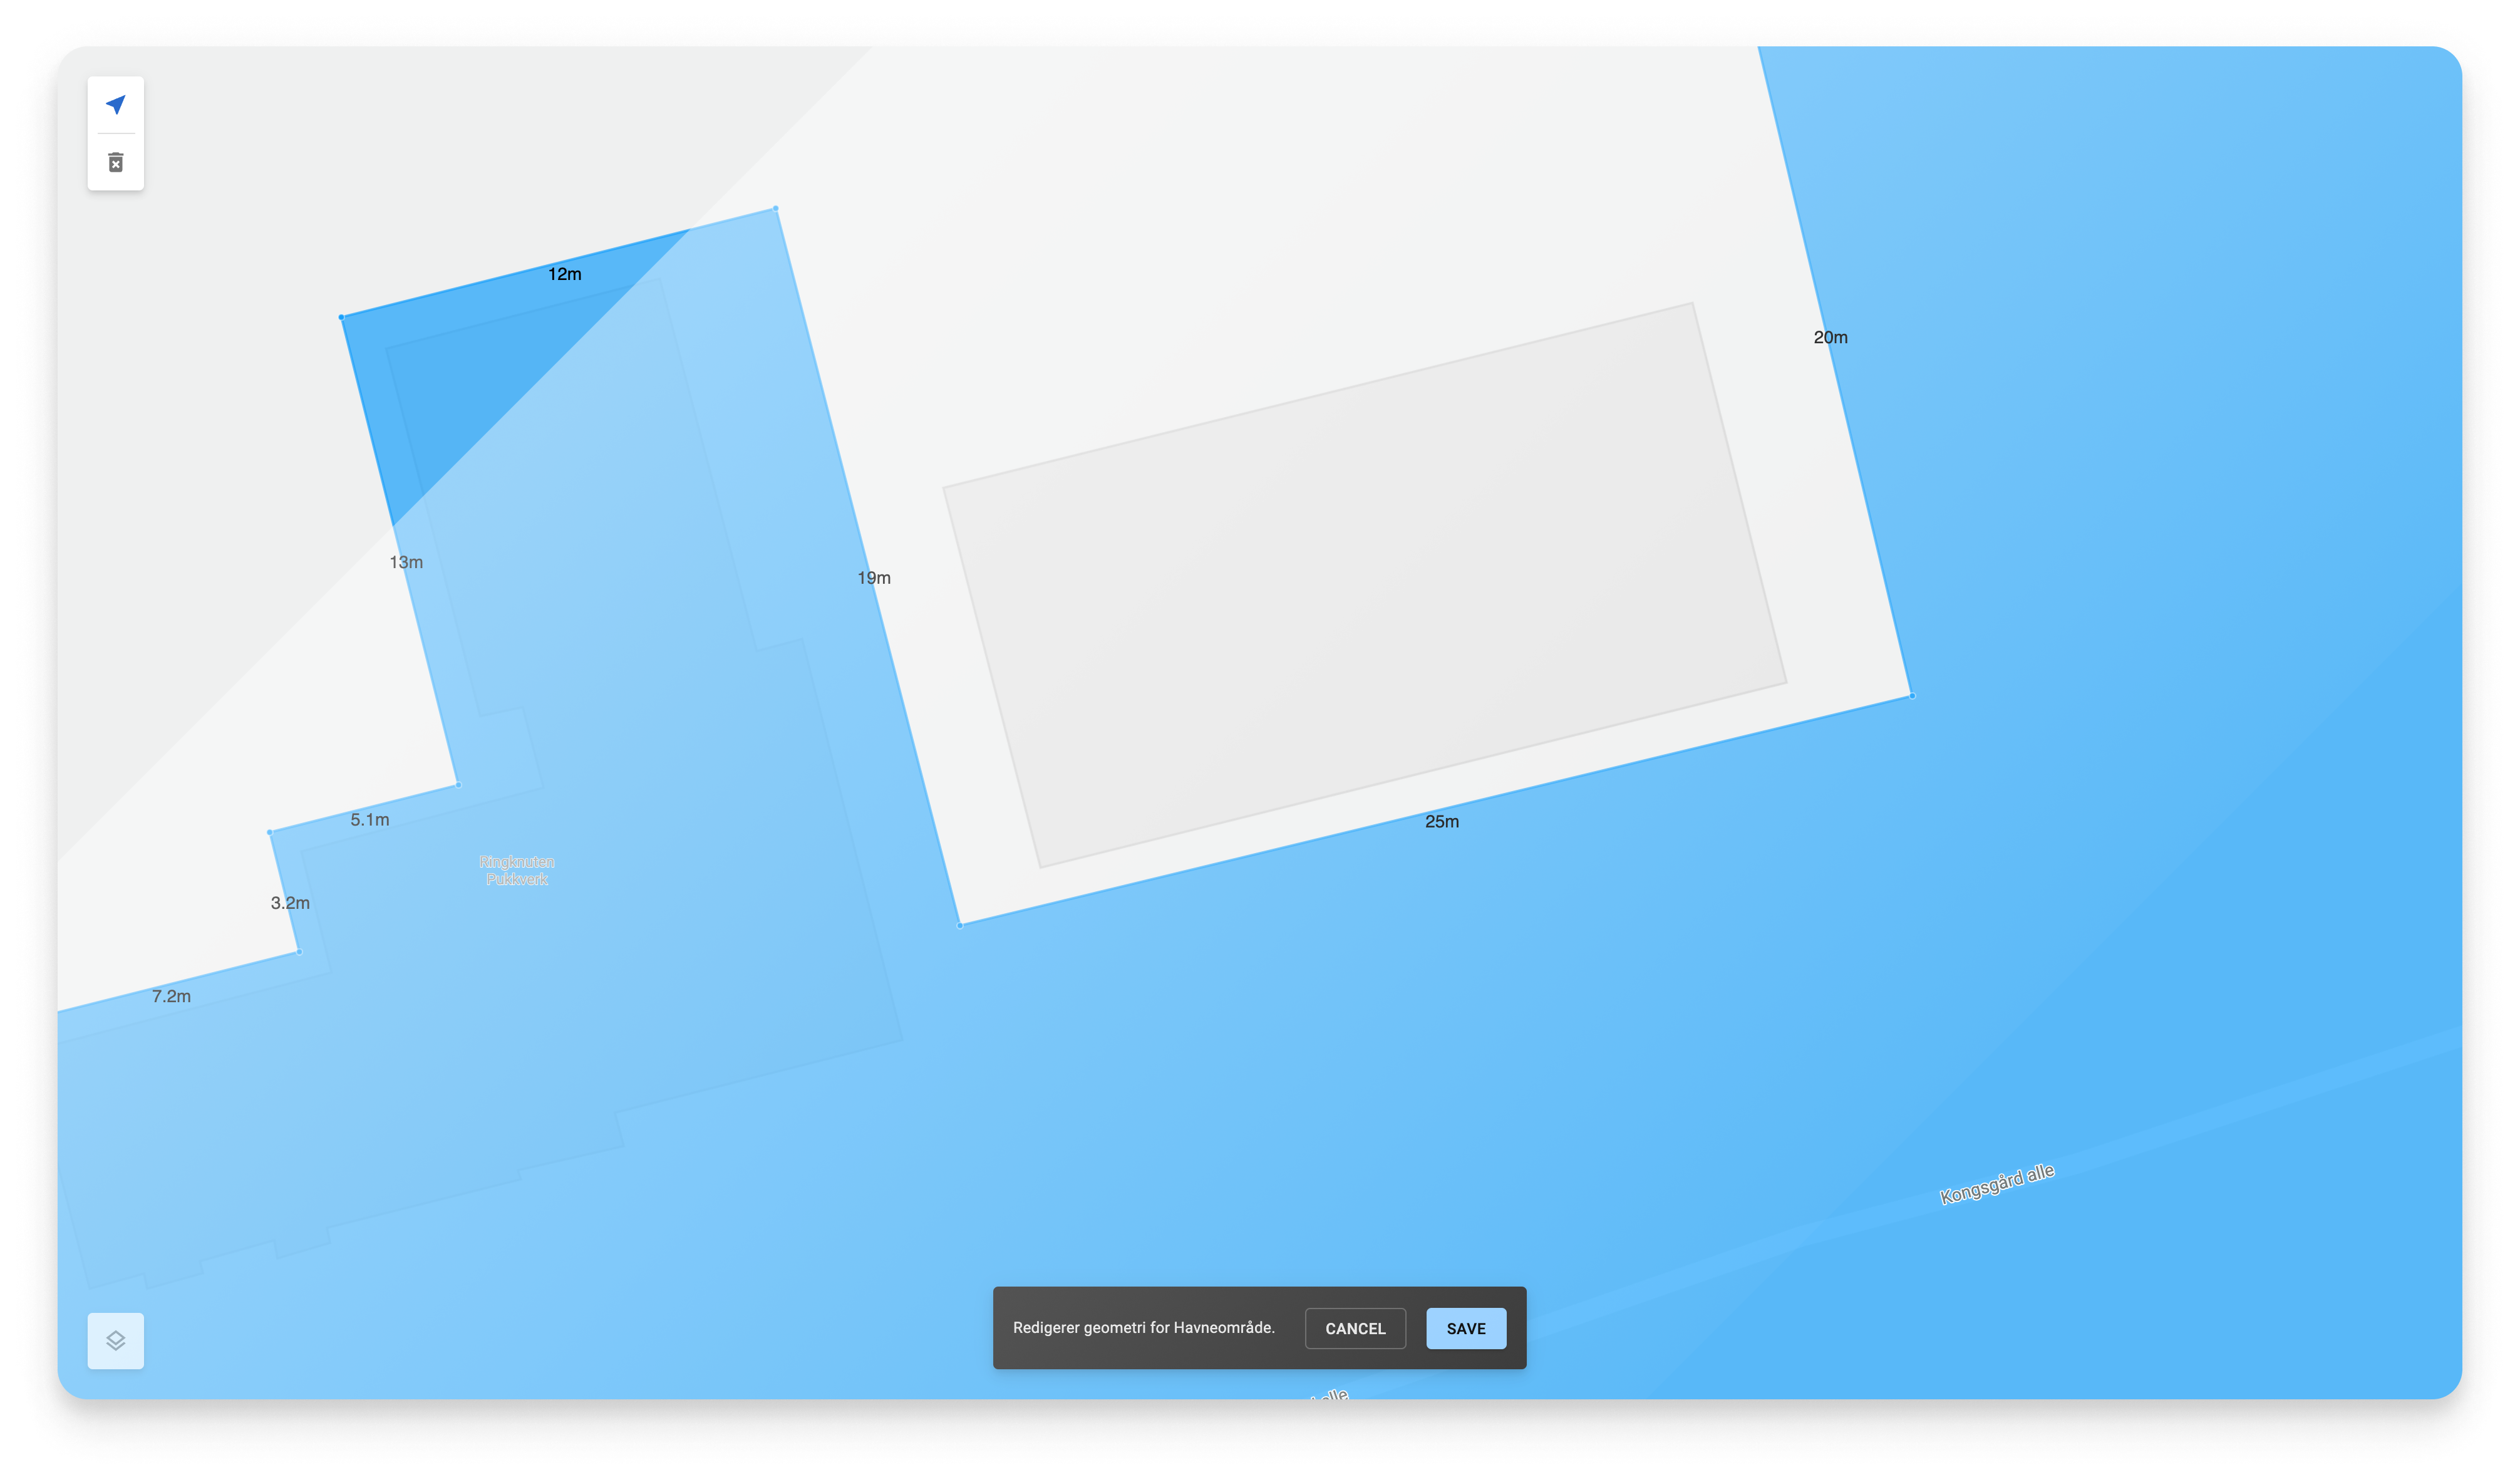
Drawing tools
Functionality are also developed to help the process of registering and managing port assets. Examples of such functions are drawing of lines, measuring of distances or angles, or drawing of areas for calculation purposes. These functions can be utilised in daily operations, for example when invoicing for rental areas.
The progress of the project is good. Opportunities for ports to use the drawing tool to add rental areas that automatically form the basis for an invoice is digitalisation at its best. A visual map and drawing tools provide a good basis for further work in the project.
Matthias Eder, Traffic Inspector, Port of Kristiansand
The next steps
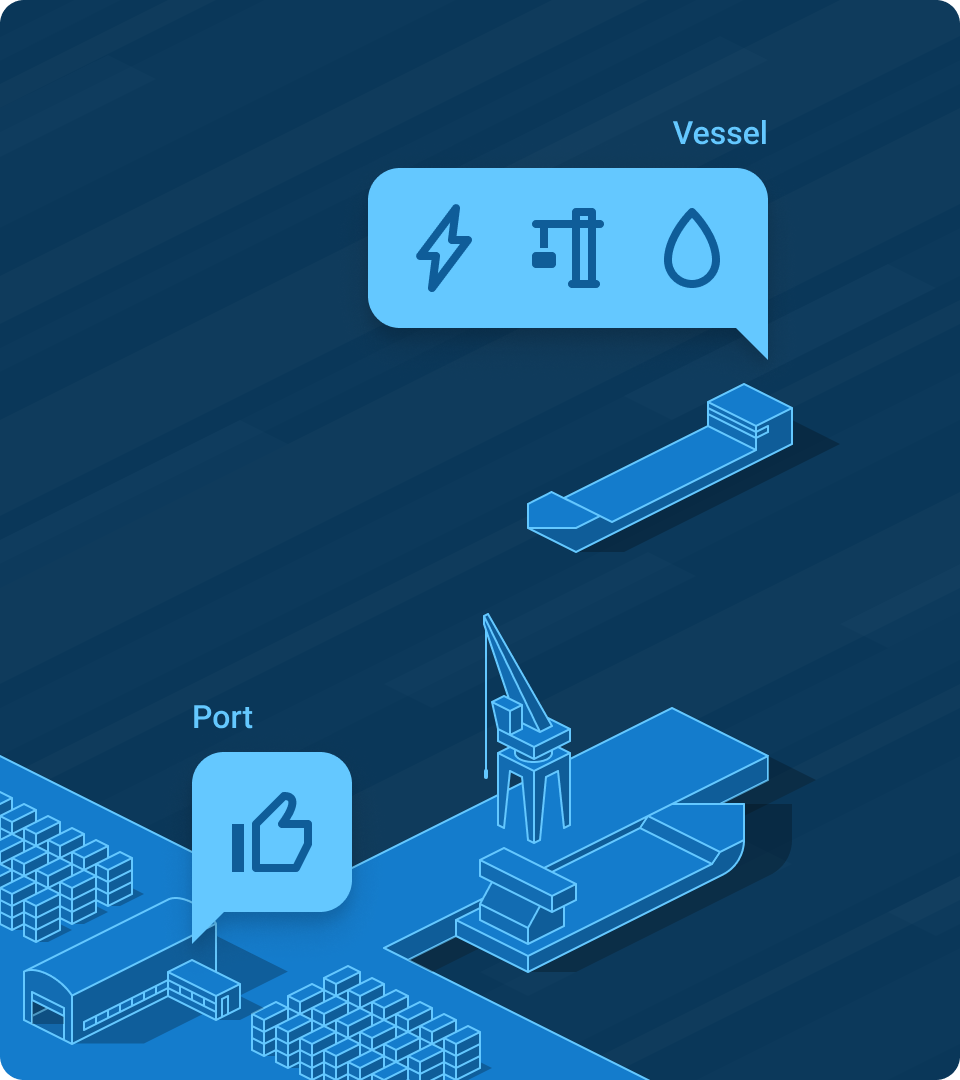
In the coming months, the project focuses on the development of a HUB, which is a collaboration tool for the port, customers and suppliers. This is part of operational functionality built on top of the port asset data. The collaboration tool is the part that will provide the greatest simplifications of everyday work, and thus also the largest savings.
Digitisation of the order flow will reduce the number of emails and telephones considerably, and give the customer a better way to interact with the port. The new Hub will also help communication from the port to the stakeholders, paving the way for more self-service. This means less repetitive tasks for the ports. This part is developed in the project ‘s Work Package 2, which is already underway. These days, Work Package 3 also commences. It is about developing port security including visualisation of ISPS data in maps.
We look forward to having a HUB in place, because then the process of ordering from vessels will be simplified for all parties involved. Together with good operational tools, this helps the planning and work at the quayside when a ship calls our port.
Ole Sebastian Lunde, Traffic Inspector, Port of Oslo KF